
29 July 2026
The PMO Dashboard Every Executive Wants
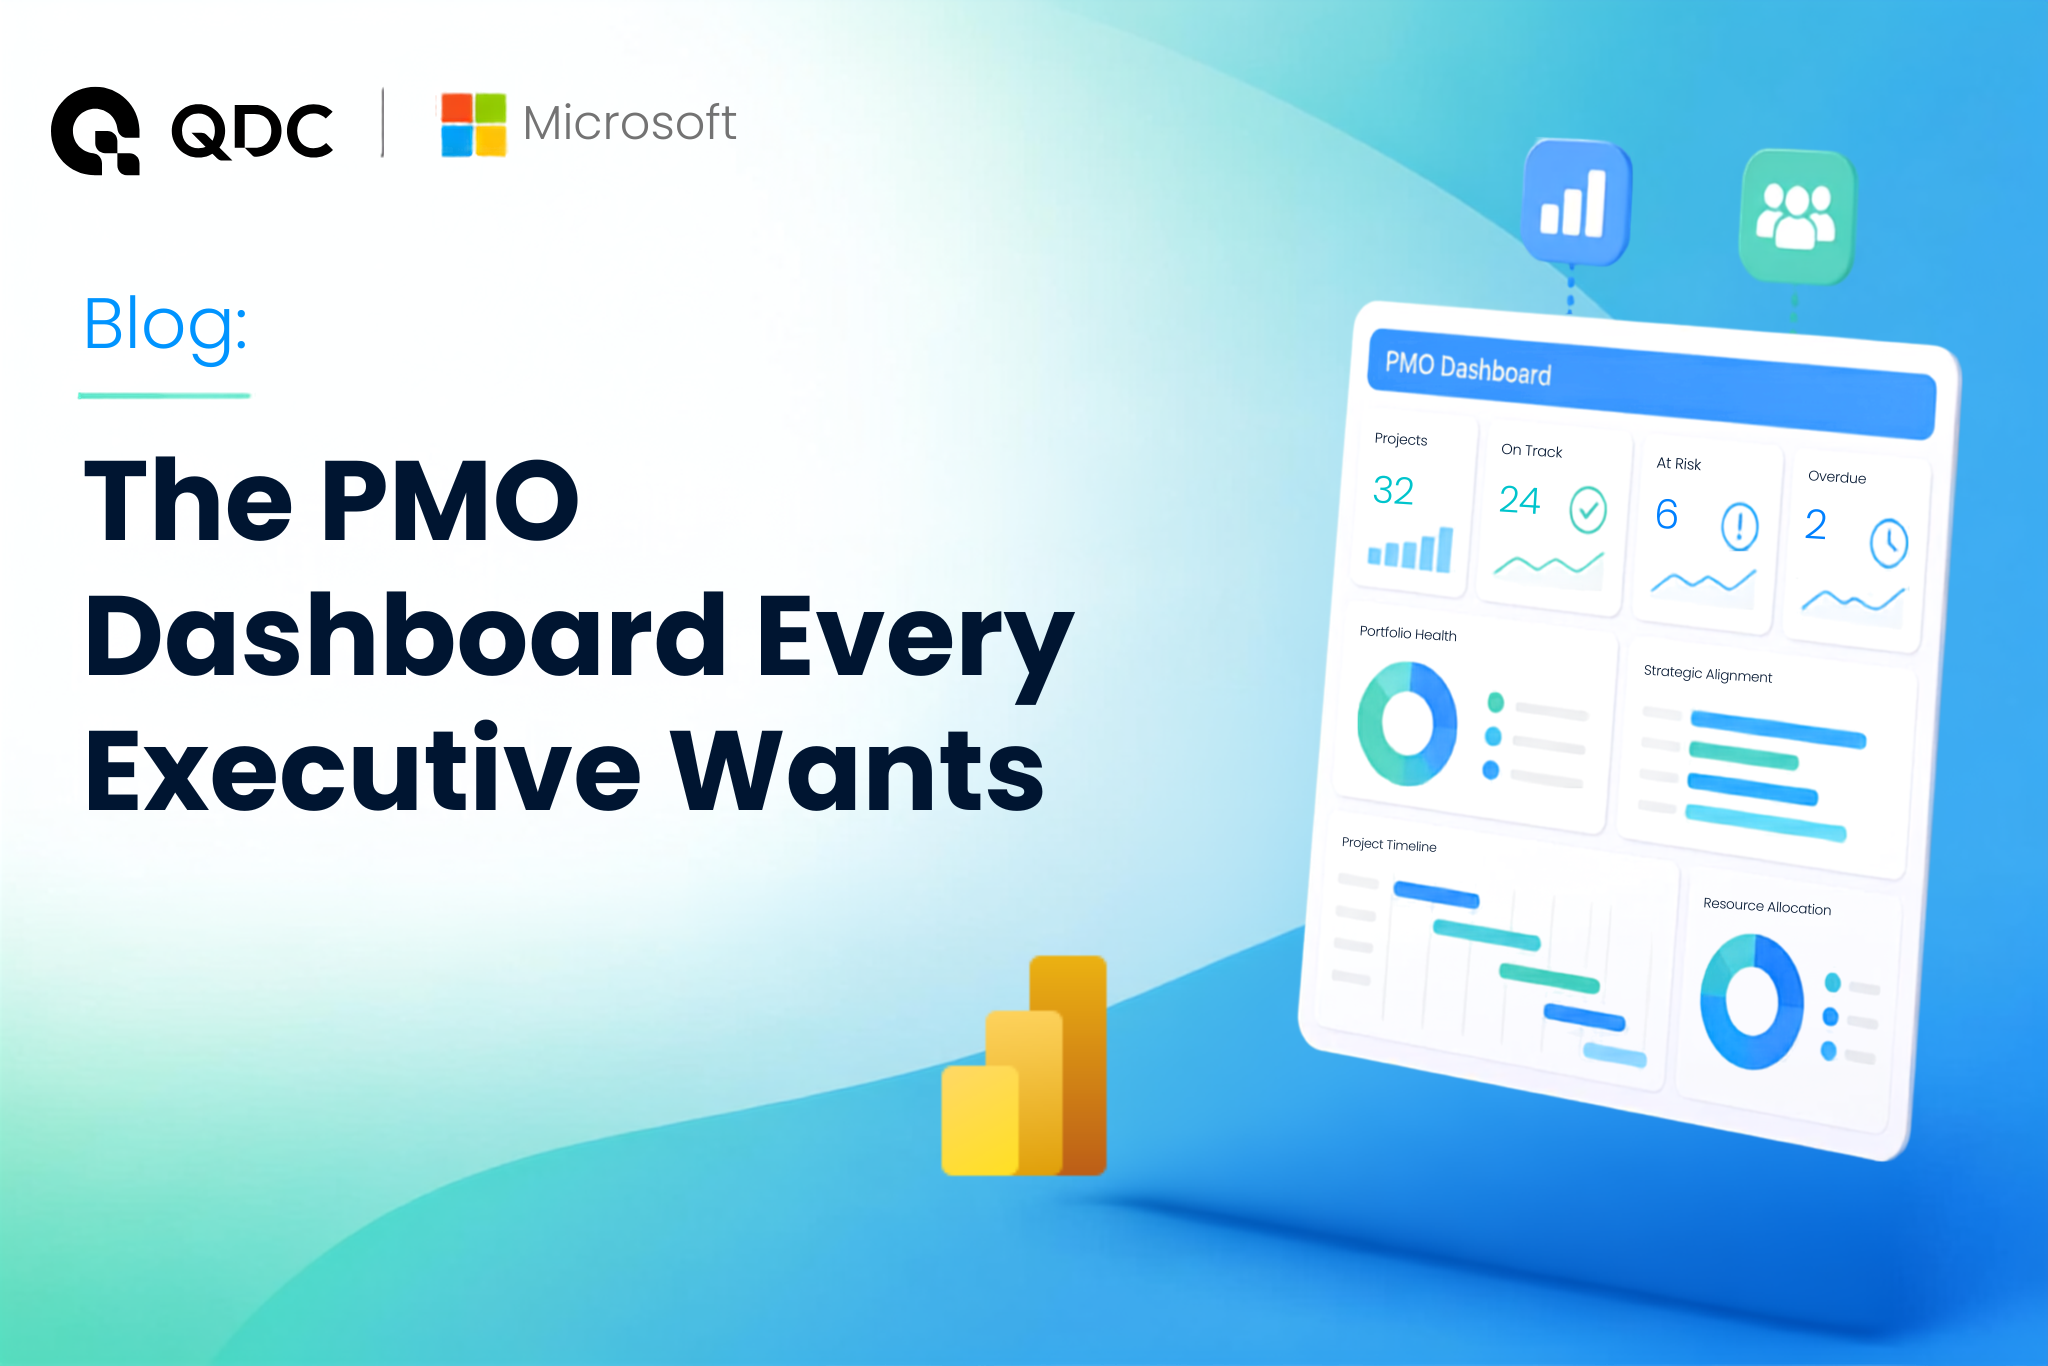
Executives need timely, accurate information to make informed decisions. A modern PMO dashboard provides real-time visibility of project performance, portfolio health, resource capacity and delivery risks, enabling leaders to identify issues early and make confident, data-driven decisions.
The Problem with Traditional Reporting
Most project reporting processes suffer from a number of common challenges:
- Significant manual effort
- Inconsistent reporting standards
- Limited portfolio visibility
- Conflicting project information
- Delayed decision-making
- Lack of confidence in data accuracy
Project Managers spend valuable time producing reports rather than managing delivery, whilst executives struggle to gain a clear understanding of what's actually happening across the portfolio.
The result? Decisions are often based on outdated information rather than real-time insights.
What Executives Actually Want to See
Contrary to popular belief, executives don't want to see every project task, action or dependency.
They want answers to a small number of critical questions:
Are We Delivering?
- Which projects are on track?
- Which projects are at risk?
- Which projects require attention?
Are We Spending What We Planned?
- Budget vs Actuals
- Forecast vs Approved Budget
- Financial trends across the portfolio
Do We Have Enough Resource?
- Current capacity
- Future demand
- Resource bottlenecks
- Key personnel constraints
What Are Our Biggest Risks?
- Escalated risks
- Programme-level issues
- Key decisions awaiting approval
Are We Delivering Strategic Objectives?
- Project alignment to strategy
- Benefits realisation
- Portfolio prioritisation
A great PMO dashboard answers these questions immediately.
The Five Essential Components of Every Executive PMO Dashboard
1. Portfolio Health Overview
This should be the first thing leadership sees.
Typical measures include:
- Red, Amber, Green (RAG) status
- Projects on track
- Projects requiring intervention
- Programme health indicators
- Delivery confidence
A simple portfolio view allows executives to quickly understand where attention is required.
2. Financial Performance
Financial visibility is critical.
Key metrics include:
- Approved Budget
- Forecast Cost
- Actual Spend
- Cost Variance
- Portfolio Investment
This allows leadership teams to understand whether projects are being delivered within agreed financial constraints.
3. Resource Capacity & Utilisation
One of the most requested PMO capabilities is resource visibility.
Executives want to know:
- Do we have capacity to deliver?
- Which teams are overloaded?
- What future demand exists?
- What projects are competing for resources?
A resource dashboard provides insight into both current utilisation and future capacity risks.
4. Risk & Issue Reporting
Risk management should never be hidden within individual project reports.
Executive dashboards should provide:
- Top portfolio risks
- Open programme issues
- Escalations
- Dependency risks
- Risk trends
This enables leadership teams to address challenges before they impact delivery.
5. Strategic Portfolio View
The final piece of the puzzle is strategic alignment.
Executives want to understand:
- Which projects support strategic objectives?
- Where investment is being made?
- Portfolio prioritisation
- Benefit realisation
This helps ensure resources and budgets are being directed towards the initiatives that create the greatest value.
Why Real-Time Reporting Matters
The best PMO dashboards are not static monthly reports.
They provide real-time information sourced directly from project delivery tools.
Benefits include:
- Reduced administration effort
- Increased data accuracy
- Faster decision-making
- Improved stakeholder confidence
- Consistent reporting standards
Instead of waiting for the next reporting cycle, leadership can access current information whenever they need it.
Building Executive Dashboards with Microsoft 365
Many organisations already own the tools required to build powerful executive reporting capabilities.
Combining:
- Microsoft Planner
- Power Platform
- Dataverse
- Power BI
- Microsoft Teams
allows organisations to create a single source of truth for project and portfolio reporting.
Rather than exporting data into multiple spreadsheets, information can flow directly from project delivery activities into executive dashboards.
The Q PPM Approach
Q PPM provides a fully integrated reporting framework built on Microsoft technologies.
Out of the box, organisations gain access to:
- Portfolio Dashboards
- Project Status Reporting
- Financial Dashboards
- Resource Reporting
- RAID Reporting
- Programme Reporting
- Executive Portfolio Views
This gives leadership teams immediate visibility across the project landscape whilst significantly reducing the reporting burden placed on PMOs and Project Managers.
Conclusion
A great PMO dashboard isn't about presenting more information.
It's about providing the right information.
When executives have visibility of project health, financial performance, resource capacity and portfolio risks in a single location, they can make faster and more informed decisions.
The result is better governance, improved delivery outcomes and a more strategic PMO.
Ready to Improve Executive Reporting?
Book a Q PPM demonstration and discover how your organisation can gain real-time visibility across projects, programmes and portfolios using Microsoft 365.
👉 Book a Demo Today