
Features
Interactive Reporting
Add a dynamic new dimension to your reporting.
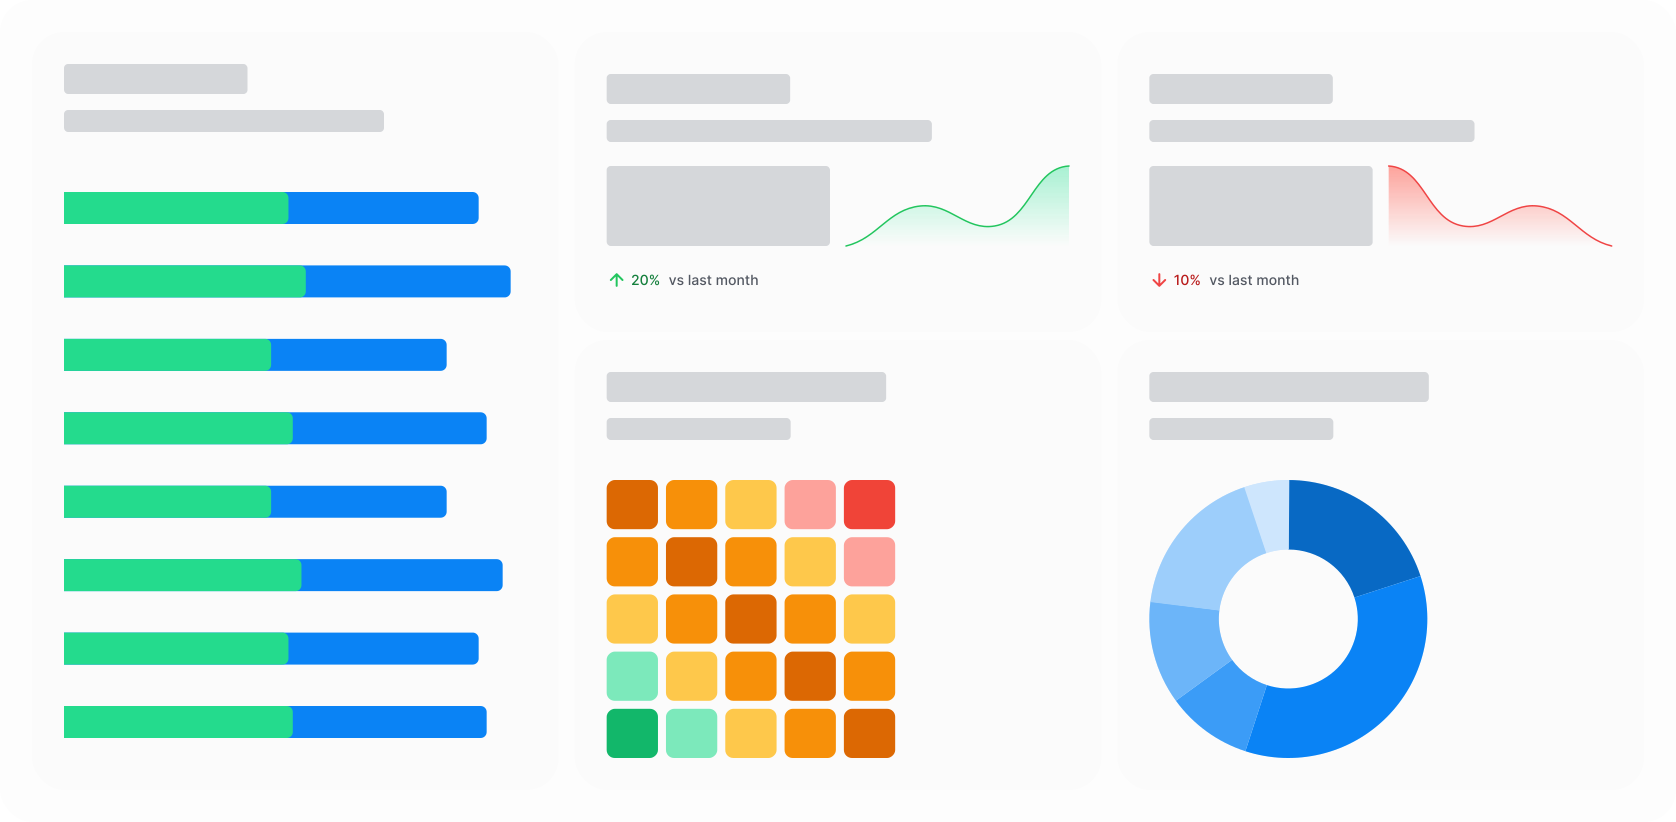
Transform all your data into live, interactive dashboards. With Q PPM, you can filter the information in seconds and effortlessly share with stakeholders.


Instant Insights
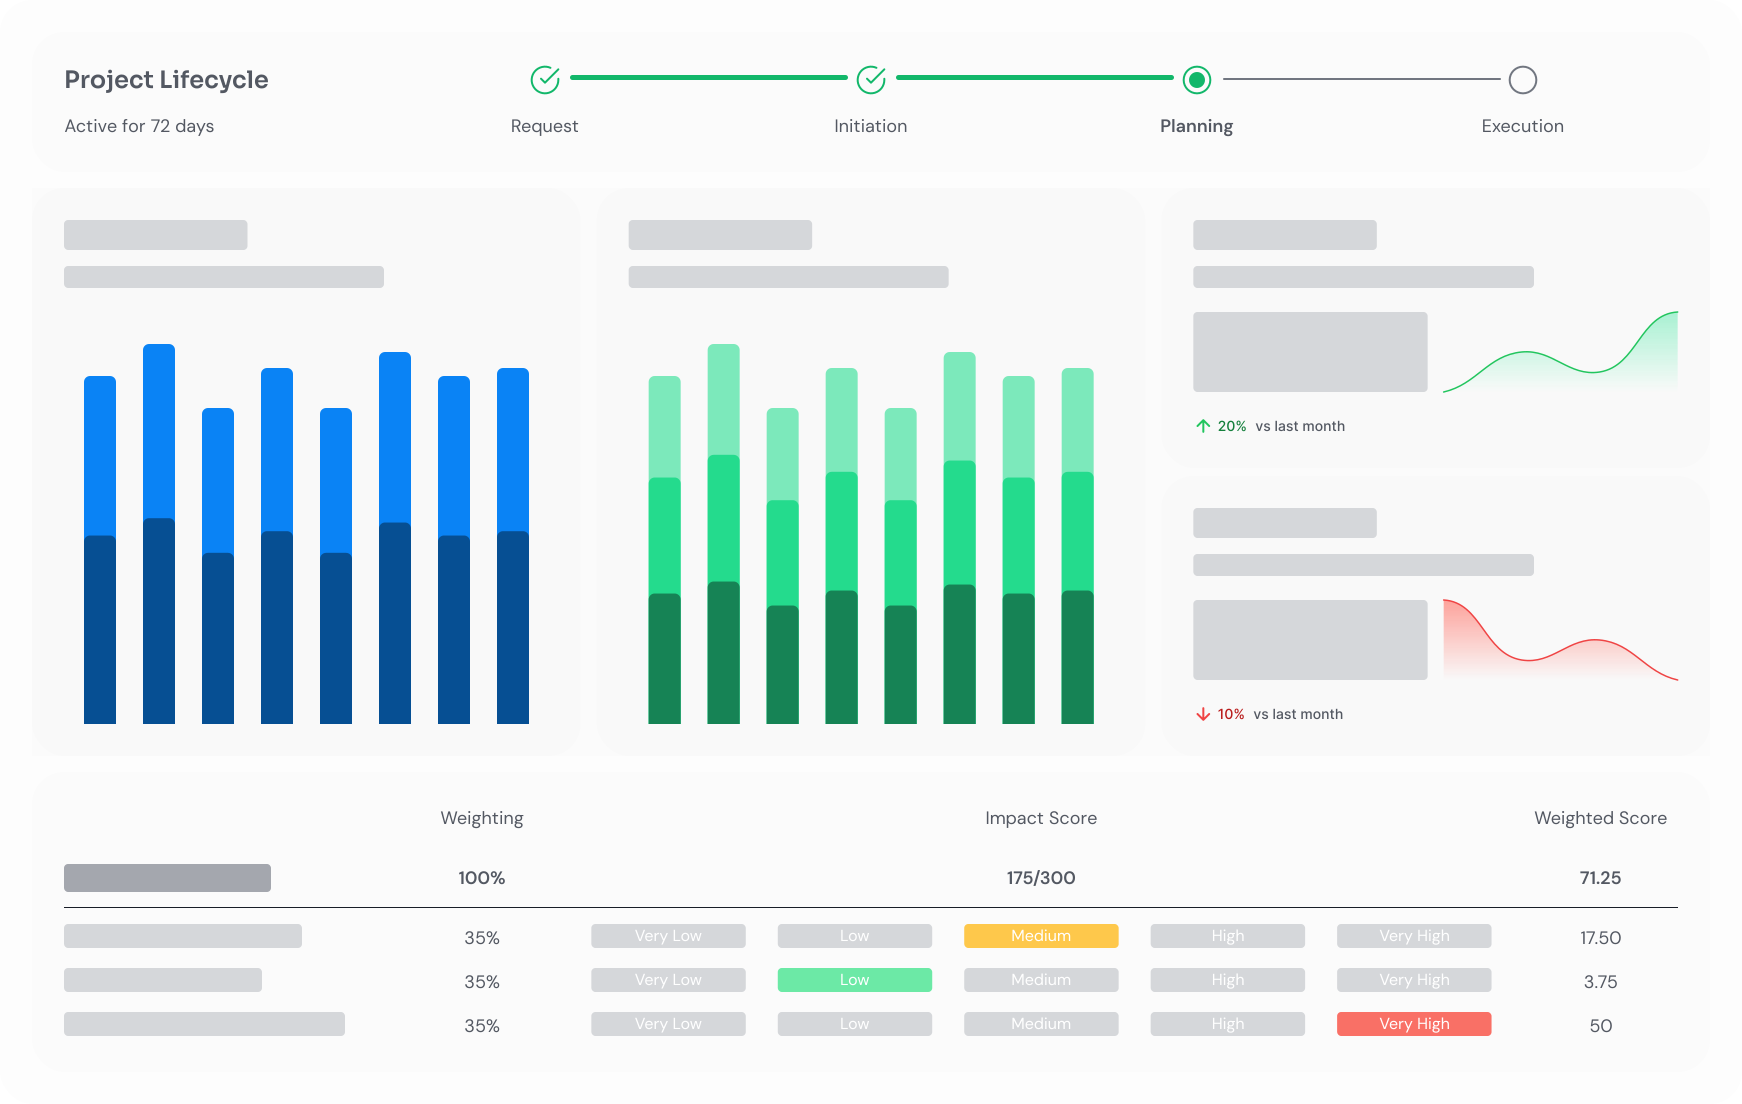
Forget wrestling with manual data and complex Excel formulas, our live dashboards make it easy to benchmark your KPIs as well as quickly identify variances and trends.

On-Demand Data
Satisfy stakeholder queries without needing support from your data analysts, using custom filters to find relevant information in seconds.

Single Source of Truth
Use your proprietary data to create standardised reports that span your entire organisation, deep dive into individual projects, or focus on one area.




Book Your Free Demo Today
Let our experts walk you through our Q Suite Solutions and explain the features that offer your organisation the most value. A strategic session, tailored to you - No hard sell.

Learn more about the features Q Suite Solutions offers.
Resource Management
Strategically grow your investments with sophisticated portfolio planning. With real-time data, you can model scenarios, compare initiatives, and make informed decisions.
Portfolio Planning
Strategically grow your investments with sophisticated portfolio planning. With real-time data, you can model scenarios, compare initiatives, and make informed decisions.
Project Management
Strategically grow your investments with sophisticated portfolio planning. With real-time data, you can model scenarios, compare initiatives, and make informed decisions.
Task Management
Strategically grow your investments with sophisticated portfolio planning. With real-time data, you can model scenarios, compare initiatives, and make informed decisions.
Financial Management
Strategically grow your investments with sophisticated portfolio planning. With real-time data, you can model scenarios, compare initiatives, and make informed decisions.
Time Tracking
Strategically grow your investments with sophisticated portfolio planning. With real-time data, you can model scenarios, compare initiatives, and make informed decisions.
Frequently asked questions
What reports are available out of the box?
The solution includes project, portfolio, resource, financial and governance reporting dashboards.
Are reports built using Power BI?
Yes. Reporting is delivered through interactive Power BI dashboards.
Can we create our own dashboards and reports?
Yes. Organisations can create additional reports using their own Power BI resources and capabilities.
Can executives view reports without accessing the application?
Yes. Reports can be shared securely through Power BI and Microsoft 365.
Does reporting update in real time?
Reports can be refreshed automatically to provide near real-time visibility.
Still have questions?
Can’t find the answer you’re looking for? Please chat to our friendly team.